CDI Scores in 2012. How do you compare?
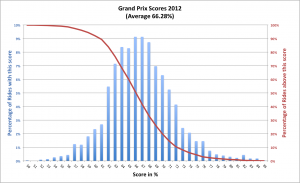
In this picture we show the distribution of all CDI Grand Prix scores in 2012. The blue bars show what fraction (percentage) of rides received a particular final score. You see the typical bell-shape curve with an average score of 66.28%. From this distribution we can produce the red curve, where we show what percentage of rides score above any given value.

The distribution of CDi Grand Prix scores in 2012. On the left axis and blue the percentage of all results for each % of final score. In red, and on the right axis, the percentage of rides scoring above a given score
You can use this to see what percentile your average or your latest score lies in. For example, if you score a 71.5% you can read off the red line on the right hand axis that about 12.5% of rides scores this or above, or looked at the other way around 87.5% of all rides scored lower than this.
(For those interested in statistics the standard deviation of this distribution is 4.8%)


Leave a Reply
Want to join the discussion?Feel free to contribute!